
A medium-to-large industrial facility implemented an IoT-based real-time monitoring system to continuously track compressed air performance across multiple production lines and compressor rooms. By integrating smart sensors, cloud analytics, and automated alerts, the plant reduced energy waste by 14%, improved leak detection response time by 60%, and enabled predictive maintenance capabilities. The system shifted compressed air management from periodic audits to continuous optimization, generating annual savings of approximately $275,000 with a payback period of around 12 months.
Traditionally, compressed air systems are optimized through annual audits, manual data logging, and temporary monitoring campaigns. The limitation of this approach is that inefficiencies, leaks, and pressure anomalies can persist undetected for months between assessments. In this facility, compressed air was supplied by five rotary screw compressors operating 24/7 across three production shifts, with an average demand of 2,100 CFM and operating pressure of 7.5 bar. Energy consumption for compressed air accounted for 26% of total utility expenses. Management required real-time visibility into system performance instead of relying solely on historical audit reports.
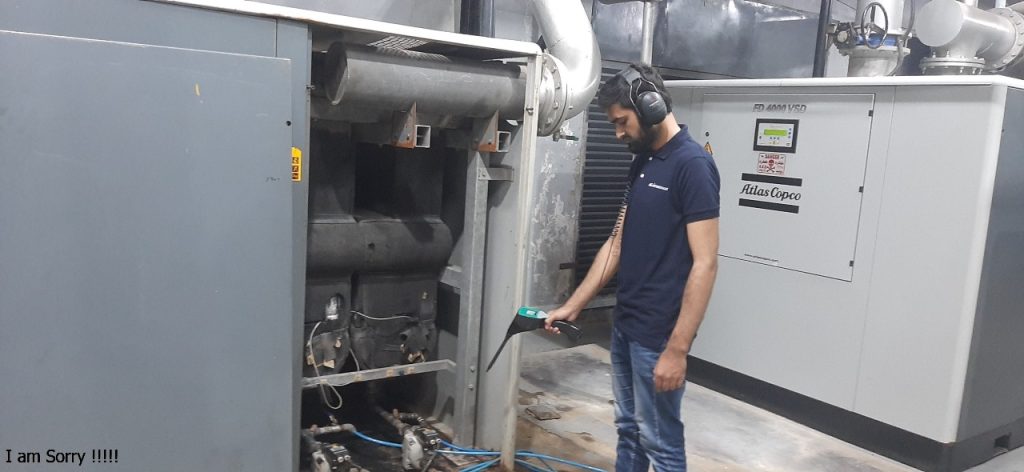
To address this gap, a four-layer IoT architecture was deployed. The sensor layer included digital flow meters installed at the main header and critical production lines, pressure transducers at compressor discharge and far-end points, power meters on each compressor, temperature sensors on cooling circuits, and vibration sensors on rotating equipment. Data sampling occurred every 30 seconds to ensure high-resolution monitoring.
The edge gateway layer collected data through industrial communication protocols such as Modbus and RS485 and transmitted it via Ethernet to the cloud. Edge computing functions handled data filtering, local buffering during network outages, and alarm threshold detection to improve reliability and reduce unnecessary cloud traffic.
The cloud analytics layer enabled real-time visualization, historical trend analysis, AI-based anomaly detection, and automated reporting. Key performance indicators monitored included real-time specific energy consumption (kW per CFM), compressor load factor, pressure stability index, leak estimation via night-load analysis, and energy consumption per production unit.
An automated alert and automation system was configured to trigger notifications when pressure dropped below 6.8 bar, when compressors operated above 85% load continuously, when unexpected flow increases occurred without corresponding production growth, or when abnormal vibration and power spikes were detected. Alerts were delivered via email, SMS, and the maintenance dashboard.
Implementation occurred in three phases. First, a 30-day baseline measurement was conducted before installation to establish reference energy consumption and estimate an initial leak level of 17%. This baseline allowed post-implementation performance comparison. Second, hardware installation included 12 flow meters, 8 pressure sensors, 5 power meters, and 6 vibration sensors, deployed during scheduled maintenance shutdowns to avoid production disruption. Third, software integration delivered a centralized dashboard with real-time compressor efficiency graphs, pressure heat maps, production-linked energy tracking, historical comparisons, and automated reporting features accessible remotely by management.
After six months of operation, measurable improvements were recorded. The system detected continuous baseline air consumption during non-production hours and abnormal spikes at specific production lines. Targeted inspections identified 142 leak points, reducing the leak rate from 17% to 9%. This leak reduction saved approximately 520,000 kWh annually.
Pressure optimization further improved efficiency. The system pressure setpoint was reduced from 7.5 bar to 6.9 bar, decreasing artificial demand and reducing compressor load by 11%. Predictive maintenance capabilities identified bearing degradation and abnormal separator heat rise in one compressor through vibration and temperature monitoring. Early intervention prevented an estimated $85,000 in downtime losses.
Overall compressed air energy consumption decreased from 3.8 million kWh per year to 3.26 million kWh per year — a reduction of approximately 540,000 kWh. At prevailing energy rates, this translated into annual savings of about $275,000 and an overall efficiency improvement of 14%.
The total project investment was approximately $350,000, covering sensors and hardware ($180,000), software platform ($95,000), and engineering integration ($75,000). With annual savings of $275,000, the payback period was between 12 and 14 months, and projected five-year net benefits exceeded $1.1 million.
Beyond direct financial impact, the system delivered continuous operational visibility, enabling data-driven decisions regarding equipment upgrades, compressor replacement planning, and capacity expansion. Automated energy tracking simplified ESG reporting and carbon accounting. Operational transparency improved as production teams gained insight into the energy impact of their processes.
Some challenges emerged during implementation. Initial data overload created confusion, which was resolved by defining clear KPIs and simplifying dashboard visualization. Employee concerns about monitoring were addressed through training sessions emphasizing optimization rather than surveillance. Connectivity issues in the industrial environment were mitigated by deploying a wired Ethernet backbone and local data buffering.
This project demonstrated that continuous monitoring provides significantly better results than periodic audits. Real-time data exposure revealed hidden inefficiencies, accelerated corrective actions, and supported predictive maintenance strategies. By digitizing compressed air management, the facility transformed energy optimization into a proactive and measurable process, achieving substantial cost savings and operational resilience.